Scientific Graphing
This quiz reviews parts of a graph
Science
7 plays
10 questions

Question 1
Multiple Choice
1 point
What is the Independent Variable in the graph?
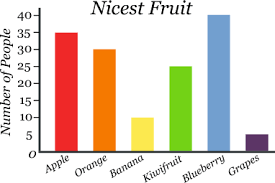
A.Number of people
B.Types of fruit
C.Nicest Fruit
D.Eating
Question 2
Multiple Choice
1 point
What conclusion can be made from the data from the graph?
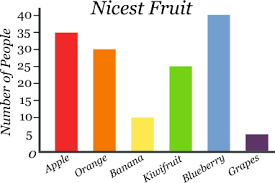
A.More people thought bananas were the nicest fruit
B.More people thought apples were the nicest fruit
C.More people thought grapes were the nicest fruit
D.More people thought blueberries were the nicest fruit
Question 3
Multiple Choice
1 point
What number of people thought kiwi was the nicest fruit?
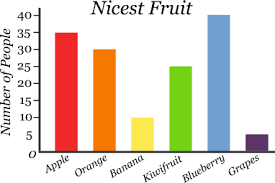
A.40
B.30
C.25
D.10
Question 4
Multiple Choice
1 point
What is the dependent variable on this graph?
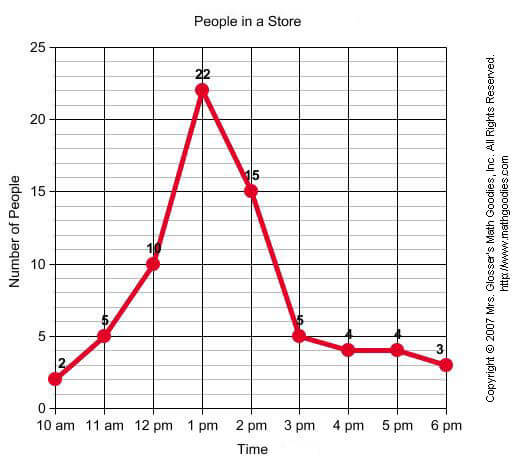
A.Time
B.Time from 10 am -6 pm
C.Number of people
D.People in the store
Question 5
Multiple Choice
1 point
From the graph, what time of the day did the store have the most people?
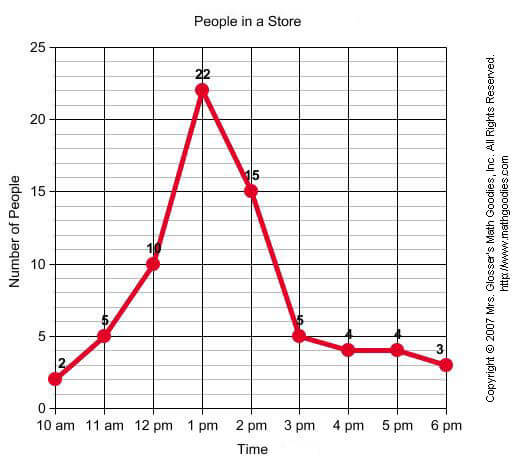
A.10 am
B.1 pm
C.2 pm
D.6 pm
Question 6
Multiple Choice
1 point
The length of your finger could easiest be measured by
A.meters
B.kilometers
C.milometers
D.centimeters
Question 7
Multiple Choice
1 point
Each independent science experiment should test how many variables?
A.1
B.2
C.3
D.as many as you want
Question 8
Multiple Choice
1 point
This type of observation uses numbers and exact data
A.qualitative
B.quantitative
C.inferences
D.guesses
Question 9
Multiple Choice
10 points
Scientists by nature are ...
A.curious
B.observant
C.skeptical
D.all of the above
Question 10
Multiple Choice
10 points
Scientists don't accept any explanation or answer unless it is backed by...
A.myth
B.evidence
C.guess
D.instagram post